"Stretching Before Workouts Makes You Weak!" Mostly True, But Your Workout Volume Will Decline Even More. Plus: Stretching vs. Doms & Stretching for Couch Potatoes

Image 1:Avoid performing stretches before your workout; if you don't do them at all, things like this are out of reach and for the avg. 'no stretcher', 'all bencher', the hunched over look is just right around the corner.
Stretching is one of those topics most trainees are not really interested in. In that most of you are probably happy that most researchers agree that passive stretches, as they may have been prescribed 50 years ago, are counter-indicated before workouts. And though the experts still disagree on whether or not certain active stretching regimen may be useful, most trainees read the headline "Stretching Before Your Workout Reduces Your Strength" once and gave up the in their eyes bothersome, unnecessary ("I've never hurt myself, although I never stretch, bro!") and with the said headline "officially" detrimental pre-workout routine and spend the they otherwise have invested in a couple of stretches either guzzling a caffeine-laden pre-workout product (which is by the way to be consumed 30-45min before a workout) or doing another three to five sets of bench presses, biceps curls and crunches, before, during or after their workout. Even if we discard the fact that neither of those practices will be largely beneficial, this does still raise the question...

Is stretching actually detrimental? And if so, how detrimental is it?

When Renato Barosso and his colleagues from from the Laboratory of Neuromuscular Adaptations to Strength Training at the School of Physical Education and Sport of the University of Sao Paulo recruited the 12 young strength-trained men (20.4 years, 67.9, 173.3cm), they probably had a very similar question on their minds.
Figure 1: Graphical outline of the time-course of the 2 x 4 (1RM or maximal repetition) testing sessions (Barosso. 2012)
As you can see in figure 1 this was a trial in which all participants ,who had been familiarized with the respective protocols on 3 familiarization sessions on separate days, underwent every of the three stretching sessions which consisted of three sets of the supine knee flex, side quadriceps stretch, the sitting toe touch which were performed in the form of
  • static stretches (SS) This is probably what you would call "the classic stretch", where you hold each stretch for 30s, make a 30s pause and continue
  • proprioceptive neuromuscular facilitation stretching (PNF) You perform a passive stretch and hold the stretching position for approximately 5 seconds; then, you perform a 5s near-maximal isometric contraction (Sheard . 2010), relax and passively hold the stretching position for another 20s
  • ballistic-stretching (BS) Same procedures as in the static stretch session, but instead of holding the stretching positions for 30 seconds, the subjects had to bob in 1:1-second cycles for 1 minute
and the non-stretched control workouts with subsequent 1RM or maximal number of repetition tests. With the 3 + 1 conditions and the two measuring outcomes being tested on different occasions, this sums up to a total of 8 testing sessions of either 1-RM max leg presses or 80%RM leg presses to failure.
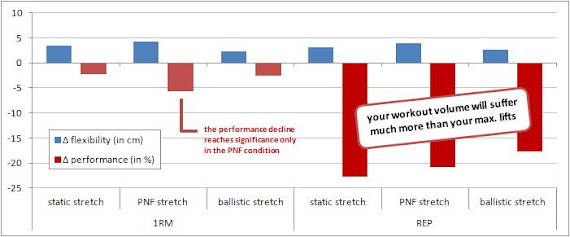
Figure 2: Absolute changes in ROM during the "sit and reach test" (in cm) and rel. changes compared to no-stretching condition in 1-RM strength and maximal number of reps during 80%RM leg presses (data based on Barroso. 2012)
As you can see in figure 2 this is not one of the many SuppVersity posts that's going to bust a myth. Stretches, no matter how you perform them, will negatively effect your strength on the subsequent workout; only the PNF protocol with its short bursts of maximal contractions, however, lead to statistically significant, yet still relatively small (-5.4%) reductions in 1RM strength. What will suffer much more than your strength, though, is your ability to endure longer workouts, or I should say, longer sets: With reductions of
  • -8.2 reps (-23%) after the "classic" static stretching routine
  • -7.5 reps (-21%) subsequent to the PMF stretching routine, and
  • -6.4 reps (-18%) in the maximal rep test after the ballistic stretch
it seems counter-indicated to perform any of these before your training session (the mean number of reps in the control condition was 36).

But doesn't stretching help against soreness? No! Neither pre- nor post-workout stretching offer a significant protection against muscle soreness, a Cochraine Review by Herbert et al. from July 2011 found "improvements" of 0.5 or 1pt, respectively, on a 1-100pts soreness scale after reviewing 12 relevant randomized controlled studies, of which one had more than 2,000 subjects (Herbert. 2011).
So, aside from preventing shortening of the muscles and increasing flexibility is there another reason to stretch? Yes! One surprising finding is that if you are a total couch-potato and don't train at all,  40min of stretching performed 3x / week over the course of 10-weeks will not just increase your flexibility (18.1%), they will also bump your standing long jump (2.3%), vertical jump (6.7%), 20-m sprint (1.3%), knee flexion 1RM (15.3%), knee extension 1RM (32.4%), knee flexion endurance (30.4%) and knee extension endurance (28.5%) performance... what? You are no couch-potato? Great, but these results do still tell you that part of the detrimental effects of stretching on your training performance may well be mitigated by the "training effect" - it's a stressin mini "workout" for your muscles and you would not do 100 body weight squats before your 80% 1RM max-rep test, either - would you?
Despite the fact that the most-heard science based argument against stretching before a workout does in fact involve its well-established negative effects on maximal strength performance, Nelson et al., Franco et al. and Marques et al. reported similar results for knee flexor exercises performed with 40, 50 and 60% of the body weight (Nelson. 2005), 1-3 sets of 20 reps of bench presses (Franco; 2009) and rep-max tests at 40, 60 and 80% knee extensions and bench presses on non-trained individuals (Marques. 2011) as Barroso et al. in the study at hand. The real "news" is thus...
"[...] that not only SS and PNF but also BS impaired the number of repetitions and the total volume (i.e., number of repetitions x external load) performed after stretching when compared with NS [and] that in strength-trained individuals, only the PNF stretching mode impaired the maximal strength production." (Barroso. 2012)
In a more general context, the latter finding, i.e. the influence of the exercise status on the strength declines subsequent to static stretches before a workout, is probably of even greater significance than the notion that you will hamper your strength endurance (note: I stick to this term here, although I am aware that most of you won't think of training at a 80% RM as "strength endurance" training): the questionable significance of data that was generated in an experiment with strength training rookies for the average physical culturist.

In the case of the effects of classic static stretching and ballistic stretches before a workout on the performance during a subsequent 1-RM max strength test, it is now clear that the results from rookies, whose performance drops compared to the no stretch condition, regardless of the protocol, the rookie data is of little to no value for anyone with a coupe of months, let alone years of weight lifting experience.

Bottom line: Irrespective of the last-mentioned problems, the take home message from this and previous studies would be the same for all strength athletes who don't just walk into the gym, crank out a single max set and head home again - Refrain from performing any kind of quasi-static stretching protocol before your workout - and don't forget to look at the study population the next time you see one of the rare studies on resistance training ;-)

References:
  • Franco BL, Signorelli GR, Trajano GS, de Oliveira CG. Acute effects of different stretching exercises on muscular endurance. J Strength Cond Res. 2008 Nov;22(6):1832-7. 
  • Herbert RD, de Noronha M, Kamper SJ. Stretching to prevent or reduce muscle soreness after exercise. Cochrane Database Syst Rev. 2011 Jul 6;(7):CD004577.
  • Marques MC, Costa PB, da Silva Novaes J. Acute effects of two different stretching methods on local muscular endurance performance. J Strength Cond Res. 2011 Mar;25(3):745-52. 
  • Nelson AG, Kokkonen J, Arnall DA. Acute muscle stretching inhibits muscle strength endurance performance. J Strength Cond Res. 2005 May;19(2):338-43.
  • Sheard PW, Paine TJ. Optimal contraction intensity during proprioceptive neuromuscular facilitation for maximal increase of range of motion. J Strength Cond Res. 2010 Feb;24(2):416-21.

Bird Of The Autumn


How's your week, peopleee? :D Finally another outfit post. So much things going on these weeks make me have to stay at home and barely even leave my bedroom to do all the tasks. I feel like a vampire in a bat cave. *le sigh* ...Sometimes it feels hard to pick just one thing to do when all of a sudden a big pile of assignments coming in to you like an avalanche, you just can't take a break. But it's a good thing that your job is keeping you busy, no? :) This one day for chilling out and read good books, is the day I really need right now.


Now look, look at this pretty dress! It is true that nice clothes are the best therapy. This dress came from She Inside, simply click here to shop the dress! :)


 I took a glance on my previous posts and realizing I rarely wear beanie hats and colored tights anymore... Wearing both together plus a coat will make you look like the girls on Korean dramas though. :)) *I might not highly updated about K-Pop trends nowadays but I always enjoy Korean series!* ...Wow, I've never felt this girly before.


Anyway, I'm inviting you to visit Ninotchka's new blog appearance! Tadaa! Heheheh. For now on if you need information about my cafe's menu, price, contact number & map, ninotchkacafe.blogspot.com will help. :)

Beanie hat - Forever 21 , dress - She Inside , coat - John Rocha , unbranded tights,
watch - Daniel Wellington , shoes - Toshop
 

Adelfo Cerame: Intermittent Fasting Done My Way - How I Break My Fast, Plan & Time My Macros and Use Caloric Zigzagging & Re-Feeds on a LeanGains Inspired IF Regimen

Image 1: Intermittent fasting, breaking the fast, macronutrient ratios and timing, caloric zigzagging and refeeds - learn how it can be done, learn how Adelfo does it!
Today's thursdaily SuppVersity post by Adelfo Cerame starts with an advertisement... "What? I thought the SuppVersity was ad-free!"... I see you are shocked!? Well, actually it ain't a real ad anyway, it's more a plug and what's best, I am plugging myself, or rather the new, likewise thursdaily radio show I am going to do with Carl Lanore. Those of you who have tuned in live or listened to the podcast (click here to download) last Thursday, when Carl was sitting alone in the studio going over the latest news-stories from the realms of health, nutrition and exercise science and I shot him an email, whether he did not want to call me to have some company, will probably already know what to expect. For the rest, I would say, the best way to describe what you will  hear today at 1PM EST on Super Human Radio would be "On Short Notice", or, in SHR-terms "Casual Sciency Thursday" - call it whatever you like, but don't forget to tune in live, or come back and download the podcast (update: click here to download the podcast), in case you already missed it

But now, without further delay Adelfo Cerame's Thursdaily Suppversity post for YOU to enjoy (the rest is ad-free, I guarantee ;-)

The intermittently fasted physique (re-)engineering nutrition 101 ;-)

If I had to name one question I get most, by clients, but even more so, by people who see me train in the gym or read my blogs, here at the SuppVersity is how I am timing my carbohydrates and meals. Especially with the folks who follow an IF style protocol, questions such as ...
  • “When should I eat my carbs?”
  • “How should I distribute my carbs?”
  • “What should my carb intake be on training days & rest days?”
  • “What about caloric zigzagging”
are things male and female gymrats appear to waste more time thinking about than about their significant others! As funny as that may sound - and to a certain degree it certainly is - there is actually an often overlooked correspondence between finding the ideal partner and the ideal nutrition regimen. Not only is it rarely your first love that you will end up marrying and spending a part if not your whole life with, it is also a matter of personal preference: Luckily, I mean if it wasn't all the guys would be chasing the same girl and all the girls would jump at just one guy ;-)
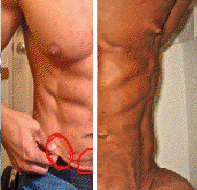
Image 2: When you are approaching this degree of leanness, you can still start worrying about all the intricacies of dieting many people waste far too much time on, when it would not even matter for them.
With nutrition things are not so much different and yet strangely people tend to lose themselves over details that would be equivalent of the size of your significant others right ear in comparison to her/his left one. What I am hinting here is that you must not lose sight of the big picture and lose yourselves in intricacies like these and their respective nutritional counter-parts before you haven't laid the nutritional foundations: Get rid of processed food, learn to cook, learn the basics about macronutrients and micronutrients how much you need and what your body needs them for and develop a sense for the energetic content of the foods you eat... "What? Calories, but I thought..."

Yeah, I know you thought "A Calorie is Not a Calorie" - that may be true, but only as long as you are referring to the black on white figures you see printed on the labels of the junk you can buy at the supermarket - intermittent fasting or not, at the end of the day, the most important determinant of whether you are or aren't progressing towards your goal is still the difference between the energy you derive from the foods you eat and the energy your body actually expends. 

You may notice that I am not talking about simple "calories vs. calories out" calculations you could do based on calorie tables and the figures your stupid heart rate monitor or treadmill are displaying. I am talking about the BIG PICTURE you always have to keep in mind and which must be set straight and be geared to your goals, i.e. weight loss, muscle or strength gains, etc., before you even start thinking about whether any those  "optimizations" of which I found that they work for me will work for you, as well.

My Twist to the Original Leangains Regimen

For those of you who have been following my Thursday Blogs for the past year or so, it won't be news that follow a 16/8 intermittent fasting protocol (this means 16h of fasting are followed by a 6h feeding window) - this protocol is based on the same fundamental principles as Martin Berkhan’s Leangains regimen. I don’t follow the exact protocol to a “T’’ (you know I am not changing Martin's girlfriend either ;-), but I stay along the guidelines, with added tweaks here and there to what’s suitable and work well for me… So here is what I prefer to do   when I break my fast and do my meal/carb timing during my 8 hour feeding window.
  • When do I eat my carbs? On training days, I prefer a protein + fat meal before I train because I feel my body runs better on dietary fats, when I train as oppose to having a big carb meal – so a protein shake + coconut oil (as a sponsored athlete I obviously use Myotropics Physique 2.0 and while I would recommend you give it at least a try, you can certainly use your favorite protein powder - preferably no whey isolate, but something "slower", like milk or a protein blend). The nourishing and long-lasting mix of WM-HDP, milk protein + MCTs from the coconut oil  is more than enough for me to fuel my workouts.

    Image 3: As it turns out the "anabolic window" is more of a barnyard door, than ...read more
    When I am back home from my workout my first real meal of the day is the one, where I place the lion's share of my carbohydrate intake. So, the meals after I train are usually high in protein and moderate to high in carbohydrates, while keeping the fat intake very modest. The reason I use this strategy is to make full use of the repartitioning effect after the workout, when your muscles will suck up more glucose in the presence of relatively moderate insulin levels. Since this "post workout window" (suggested read "Opening the 'Anabolic Barn Door' With the Key of Exercise and Nutrition Science!") also happens to fall in the evening, I don't have to worry about (a) bunking later in the day or (b) overeating and feeling sluggish, I just fill myself up with carbs and relax... when I go to bed later, I am still happy and satiated and ready to get some quality sleep.
  • Which carbohydrate sources do I use on workout days? While I am now going to give you a list, the latter is not supposed to be extensive - it's more to give you an idea of the broad range you can pick from without ever having to resort to the "carbage" that's making people fat and sick and has brought all carbs into disrepute.
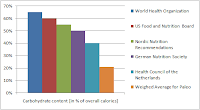
    Figure 1: Recommended (mean) carbohydrate intake in %-age of total calorie consumption ... read more
    • sweet fruits like ripe bananas, pineapples, mangoes, cherries, papayas 
    • starchy carbs like sweet potatoes, organic russets, yams, colored potatoes, butternut squash, rice
    • variety of veggies
    If my macros allow for it and I can sneak it in – ice cream, Hawaiian bread, peanut butter and jelly sandwich, cheesecake, mochi - but occasionally!

    On non-training days I spread my macros pretty evenly across the 6h feeding window, with a lower carb intake on non-workout days and mostly being from veggies and fruits this will allow for optimal insulin levels all-day. Consequently, all my meals are high protein + high fat based; I've always fared very well with this strategy and feel that my body doesn’t need much carbohydrates on days I don’t train and those I do eat mostly come from...
    • a variety of veggies, which I always eat to satiety
    • a couple of slices of tropical fruits such as pineapples, papayas, plantains, kiwi, mango, coconuts, guava…
    In the end, most of my non-training day meals will thus be more or less "Vince Gironda"-ish, such as the food he consumed on his steak & eggs diet, or his Hawaiian diet that consists of a combination of lean meats and tropical fruits.
     
  • Caloric ZigzaggingCaloric zigzagging is another one of those advanced techniques I hinted at in the introductory part of this blog, it can facilitate and optimize fat loss, but is neither necessary to make progress nor optimal for everyone.

    Caloric zigzagging is not a must and not for everyone, either: In my opinion, caloric zigzagging, is not a beginner technique and the benefits are too small to risk getting totally confused . For beginners or people that just get confused with tracking numbers its much easier to just diet down and incorporate re-feed days rather than having to remember “x amount of carbs on this day, and x amount of carbs on that day” … But for individuals like myself… I don’t mind. Plus, with the protocol I follow, where I eat starchier carbs on training days and more fibrous carbs on non-training days; my caloric intake will tend to be lower on rest-days, anyways.
    Rather than just following a regular downward spiral, where you continuously decrease a constant daily calorie intake (independ of whether you work out or not) over a pre-defined, short timespan (4-6 weeks), caloric zigzagging will add an andditional "zigzag" component to the regimen, where you will now vary your calorie (and macronutrient intake according to whether you train or rest on a given day: Basically the idea is you will eat a little bit more, when you train to make use of the priming effect workouts have on the departments (muscle vs. fat) your body is going to store the nutrients, respectively the energy it derives from it in. On non-training days, on the other hand you eat less, and have your body feed of his body fat stores. There is however one thing you must never forget: At the end of the day it’s still about energy in, energy out, and your overall food consumption. Caloric zigzagging is just another one of those little pieces to the BIGGER PICTURE in which, as Dr. Andro would say it,  "weight gain and weight loss are nothing but the two complementary and yet incommensurable sides of the same coin".

    So, for example, my training day macros can look something like this; 200g protein/ 150g carbs/ 65g fat – then my rest day macros would look like this: 200g protein/ <100g carbs/ 65g fat. And again, different scenarios or phases in your cut will dictate how you make your macronutrient adjustments. Sometimes I can start off doing caloric zigzagging and by the tail end of my diet; I’m back to the good old proven and effective downward dieting.
     
  • How do I incorporate refeeds into my intermittent fasting routine? Re-feed days are usually incorporated into a diet once an individual starts to get leaner, calories are decreased, and metabolism starts to level out. In my experience, I did not have to incorporate re-feeds into my diet for the first 3 months. I had a cheat day, when Thanksgiving, Christmas and New Years came around but those were the only cheat days I incorporated into my diet for the first 3 months from October – January. The rest of the days out of those 3 months, I did just fine.

    I didn’t start incorporating re-feed days until around maybe mid-January, when I was really starting to dip into the single digit body fat % range. I would then still follow my 16/8 protocol and break fast on Sunday as I would any other day, but the leaner I got, the bigger and more important my Sunday refeeds became - to the point, where I was starting my re-feeds and breaking fast @ 10am and ending my them at 11pm. Lol.

    During my first contest prep of this year my re-feed days were pretty ridiculous. I never kept track of what I ate on my Sunday re-feeds. The only guidelines I followed were keep protein moderate, fats low, and carbs HIGH! And I ate literally the whole day. I never kept track but one Sunday I was curious to see how much carbs I was taking in, and I must have had almost ate 800+ grams of carbs that whole Sunday! And just in case you’re curious about this type of re-feed type style, it’s called skiploading (google it, and you’ll get the concept of it)! Or you can just double back to one of my re-feed blogs from a couple months back.

    Image 4: It's not just the nasty subcutaneous water you can avoid, when you don't abuse your refeed days to binge like a maniac!
    During my 2nd contest prep of this year my re-feeds were a bit more controlled this time around. I learned from a couple of Dr. Andro’s articles (esp. "Carbohydrate Shortage in Paleo Land") that the average indidual would not need more than max. 400g of carbs  to refill his glycogen stores (needless to say that those must not all come from dextrose or be eaten in one meal).

    Moreover, our glycogen stores don’t get as depleted as we think. It’s damn near impossible to fully deplete your glycogen stores during a single workout. Even after an intense session of high volume training, I don’t think even 50% of our glycogen stores get depleted – So long story short, I realized that I didn’t need to go overkill on the re-feeds 400g is more than enough to fill glycogen stores.

    I stuck to this principle and it has not just always worked well for me, but also helped me to avoid the nasty bloating, the gastrointestinal distress and the all the other dreaded short term and often overlooked negative longterm health effects of stuffing yourself with carbage fooling yourself to believe you were "refuelling your glycogen stores".

I hope this helps you answer some of your questions, provide orientation and give you inspiration to design and tweak your own (intermittent fasting) diet routine. And while this is all I have for you today, SuppVersity readers you are of course welcome to post additional questions and comments in the comment area below! So, tune in next week for another session with yours truly ;-)

5% Calorie Restriction & Longterm Dieting Make You Fat and Insulin Resistant. Plus: Model Predicts Weight Loss Based On Number, Weight Lost & Diet Pill Use On Previous Diets

Image 1: "Bikini Body Now!", headlines like this and the unfair suggestion that by following diet X or taking supplement Y you would make it onto the cover of a magazine like that are part of the problem why diets fail, people get discouraged and caught in the diet trap.
The issue of yoyo dieting and the existence and non-existence of a body weight or body fat set-point has been an issue in more than a handful of SuppVersity posts, already (click here to read more). None of the studies I cited (and not even one of those I have read) did yet provide a conclusive and experimentally verifiable answer to the question whether or not there is such a thing as a "set point" and how or even if dieting influences the latter. What common "wisdom" would suggest, though, is that dieting will ruin your metabolism, so that both the post-dieting weight rebound, as well as future problems with losing weight would be programmed.

So the question is: Can you diet yourself fat?

As I have pointed out in previous posts, as well, the hypothesis that you cannot only diet yourself fat, but also make it practically impossible ro reverse the damage is supported by a myriad of N=1 reports on the Internet, objective evidence, on the other hand, is very rare, often inconclusive and mostly either of epidemiological or experimental nature.

In the case of the most recent study from the Pennington Biomedical Research Center at the Louisiana State University, this is yet somewhat different, as it is one of the few studies to combine a controlled dietary intervention with a focus on lifestyle changes that went beyond just telling participants to cut calories (and fats ;-) and a detailed epidemiological analysis of the weight loss history of the subjects to produce a model that would actually allow predictions of future weight loss based on specific aspects of the weightloss history of a given individual.
Figure 1: Based on the diet history and the weight loss success during the 6-month weight loss intervention, the scientists developed a model to predict future weight loss - I would take the exact quantities with a grain of salt, but the qualitative trend, as well as the confounding factors are interesting (data based on Myers. 2012)
As you can see in figure 1, there is something like a "breaking point" at the 10+ diets margin, when it comes to the ability to lose weight. Aside from the fact that you will have all dieters with more than 10 diets packed in there (people could have dieted 100 times or more!), this is by no means evidence for the existence of negative physiological / metabolic side effects of dieting.

In view of another important finding of the study, which is the prognostic validity of previous successful weight loss (figure 1, left) as a positive indicator of future weight loss success, it is much more likely that people who failed 10 or more times, simply make the same mistake(s) over and over again - and while most of them are probably falling victim to one or another of the following culprits
Did you know that a reanalysis of data from the DiOGENES study, a large scale dietary intervention with participants all across Europe, yielded an astonishing result which is yet pretty much in line with the weight loss success of the biggest losers Myers et al. report?

According to Monica H.T. Wong and her colleagues, who scrutinized the weight loss and subsequent weight maintenance of 502 study subjects from 8 different study centers, those participants who lost the most weight during the initial 8-week weight loss phase on a very low calorie diet (800kcal/day) were also the ones who did best in staving the weight off!

Moreover, neither the starting weight nor the glucose sensitivity were significantly associated with the ability to weight and to avoid the dreaded weight rebound, in the course of the 6-months follow up (Wong. 2012). After the weight loss, on the other hand, those participants who lost the most weight also saw the greatest improvements in insulin resistance - ex-post, this could therefore at least be one physiological factor contributing to the long-term success of the biggest losers.
  • following an unbalanced, single-sided / fad diet (e.g. cabbage diet, etc.)
  • starving themselves for X weeks and falling off the wagon, before lasting results can even be achieve
  • cheating too often / not cheating at all
  • overexercising (and undereating)
  • doing no exercise at all
  • meticulously counting  calories and grossing up energy expenditure (as measure with a heart rate monitor and pieces of cake eaten after the workout)
  • eating too little protein to ever be satiated and keep your muscles from being cannibalized 
  • eating too much protein (and no carbs or fats) and running on cortisol and catecholamines until you crach
  • (ab-)using fat burners (esp. stims) and burning out (cf. figure 1, right)
  • seeking for the magic pill, both in supplement and diet form
  • sticking to a diet, because it worked so well for X months, when your body has long changed and the previously optimal diet is now inappropriate for your novel you (e.g. following Atkins diet when you got rid of most of the blubber and turned to physical culture)
an older study by Xi et al. appears to suggest that one item that's not usually on lists like the above could pose a similar, if not even more pronounced thread even to the "educated" dieter.

Being in a very mild caloric deficit, is no solution, but a potential cause of the problem. In fact, "not dieting hard enough" could be just as detrimental, as any of the previously mentioned self-imposed obstacles.

Figure 2: Total and resting energy expenditure of mice that were exposed to a -5% reduction in energy intake for 21 days (graph from Xi. 2010)
This is at least what the results of a study from the Department of Nutrition Sciences at the University of Alabama at Birmingham, Birmingham in Alabama, would suggest.

In 2010, already, Xi et al. have shown that a mild (=5%) reduction in energy intake is probably the worst approach to dieting rodents (and probably humans, as well ;-) can take, as it triggered...
  • increases in fat mass (p < 0.01) 
  • decreases in lean mass (p < 0.01),
  • decreases in total energy expenditure (p < 0.05) and  
  • resting energy expenditure (p < 0.05) 
and all that within no more than 3 weeks and in the absence of reduction in locomotor activity (Xi. 2010) - which means that you cannot exercise these detrimental effects away!

The HIID solution: High Intensity Interval Dieting to get ripped and stay ripped?

You may now certainly complain that biggest losers and mice are nothing you want to go by and you are certainly right; yet still, the notion that slow and steady is not the way to go is also corroborated by results of another 2010 study, this time done in humans and not from Alabama, but from the Washington University School of Medicine, where Fontan et al. conducted an ex-post analysis of the effects of really long-term moderate caloric restriction (and endurance exercise) on insulin-sensitivity and glucose management.

The subjects of the study were 28 volunteers, who had been eating a calorically restricted diet for an average of 6.9 +/- 5.5 years, (mean age 53.0 +/- 11 years), 28 age-, sex-, and body fat-matched endurance runners (EX), and 28 age- and sex-matched sedentary controls eating the SAD or standard Western diet (WD). (Fontana. 2010):
Figure 3:  Parameters of glucose management in 23 subjects who have been following a calorically restricted diet for ~7y  (range 3–20 years; CR) and 28 endurance runners who had been training for an an average of 21 years (range 5–35y; 20 to 90miles/week) relative to 28 sedentary (regular exercise <1 h per week) age and sex matched individuals eating typical Western diets (WD); data calculated based on Fontana. 2010.
Probably much to the surprise to all researchers who love their worms and fruit flies and still believe that starving was the solution to all your problems, Fontana et al. found that long-term caloric restriction in the absence of exercise had statistically highly significant negative consequences on glucose tolerance, as measure in a standardized oral glucose tolerance test (figure 2, small graphs). What's particularly interesting though is that
  1. the non-exercising long-term calorie restricters were practically insulin resistant and still had perfect HOMA-IR values, and that
  2. among long-term dieters there were only 11 subjects (CR-IGT subgroup) who were so glucose intolerant that the result was still statistically significant, though the other 12 subjects' (CR-NGT subgroup) ability to clear the glucose from the bloodstream was in the normal range
Now, while former (1) does tell you much about the validity of HOMA-IR values as a marker of insulin resistance in people on long-term calorie restriction, the latter (2) observation flies right into the face of the "cut your calories to live longer and healthier" paradigm - after all, those 11 calorically restricted subjects had apparently become (or maintained?) glucose intolerant despite having lower BMIs and lower caloric intakes than their peers (1,858 kcal/day, BMI 18.6 vs. 1,729kcal/day, BMI 20 in glucose tolerant caloric restriction subjects, CR-NGT).

Due to the size of the two subgroups in the calorie-restricted group on which Fontana et al. conducted a sub-analysis, we cannot come to any clear-cut conclusions with respect to physical mechanisms that would  explain the general tendency towards a reduced glucose tolerance and the intra-group differences between those who stayed glucose tolerant and those who are now underweight, malnourished and still glucose intolerant:
Dont fall for the false believe that being "normal weight" or even skinny means being healthy! Researchers from the Mayo Clinic in Rochester have found only recently that subjects with normal BMI but central obesity as defined by a high waist-to-hip ratio had the highest cardiovascular death risk and the highest death risk from all causes among the six subgroups (normal weight / overweight / obese x normal waist-to-hip ratio / high waist-to-hip ratio). The risk of cardiovascular death was 2.75 times higher and the risk of death from all causes was 2.08 times higher in normal weight obese people as compared with subjects with normal BMI and normal waist-to-hip ratio. And Dr Lopez-Jimenez points out: "Our research shows that if a person has a normal BMI, this by itself should not reassure them that their risk for heart disease is low. Where their fat is distributed on their body can mean a lot, and that can be determined easily by getting a waist-to-hip measurement, even if their body weight is within normal limits." In lights of the increased fat deposition in the aforementioned rodent study by Xi et al., constant calorie restriction is thus probably not the way to lead a healthy, let alone happy life (ESC. 2012).
"To try to obtain some insight regarding the mechanism responsible for this difference, we did a post hoc evaluation of the data. There were no significant differences between the CR-NGT and CR-IGT groups in either the HOMA-IR (0.32±0.20 versus 0.24±0.10) or the ISI (19.6±7.6 versus 16.8±4.7). Fasting plasma glucose, insulin, and C-peptide concentrations were similarly low in the two CR subgroups. Plasma 30-, 60-, 90-, and 120-min glucose concentrations were significantly higher in the CR-IGT subgroup than in the CR-NGT subgroup. Glucose AUC was significantly higher in the CR-IGT group than in the CR-NGT subgroup. Plasma insulin and C-peptide concentrations after the glucose load were not significantly different between the two CR subgroups except for the 120-min C-peptide value, which was higher in the CR-IGT groups. Insulin AUC and C-peptide AUC were not significantly different between the CR-IGT group and the NGT-CR group." (Fontana. 2010)
If you take closer look at the actual data there are however certain parameters that could at least point into the right directions for future research and provide us with some clues that may help us in setting up our own dietary regimen.

Though not statistically significant (mostly a result of the small size of the dataset for this sub-analysis with N=11 and N=12 subjects in each group), there are a couple of things, it cannot be negated that the insulin tolerant subjects had ...
  • 33% higher IGF-1 + 78% higher testosterone levels,
  • 36% lower fiber intakes + 28% greater VO2MAX
  • 8% higher BMIs
than their insulin resistant peers. Now, you tell me what does "Lower fiber intake, higher IGF-1, higher testosterone, higher BMI" sound like?

Yeah, exactly the nightmare of every physician and exactly what the medical orthodoxy would consider to be indicators of a skewed metabolism and would be trying to solve by putting you on a fiber-laden energy, fat, nutrient and often even protein deficient diet that may work as long as you are morbidly obese and every pound less on the scale takes you one step away from dying from a heart attack but will make you, an already (more or less) lean physically active individual starve yourself into an asexual catabolic state, of which I do not believe and do not even care if it will allow me to live 2 or maybe even 10 years longer...
So what? Conventional wisdom will tell you that the first diet is always the most successful one, that you will regain weight after dieting, no matter what, and that it will become increasingly difficult to get rid of the fat and avoid the yoyo effect.

And in fact, all this will become true, as long as you do your very best to make it become a self-fulfilling prophecy by setting yourself unattainable goals (e.g. "by tomorrow everything will be different") and regarding your "diet" as a temporary step to get from A to B (e.g. "I lost 50 pounds! Hurray, let's party for the rest of the year...")
Implications: Before I get into an essentially pointless rant, let's briefly recapitulate what main, or I should say most relevant outcomes of the individual studies were:
  • Myers' and Wong's studies "proof" only one thing: You got to be prepared to and actually make lifestyle changes! If you do, you will have success, huge success, in fact, in losing and staving off the weight.
  • Xi's and Fontana's studies, as well as the recent results from the Mayo Clinic, on the other hand, underline the fallacy of lifelong dieting. If anything, it is this, i.e. never eating to satiety, always counting calories and disregarding the mandatory nature of exercise, that's underlying reason of "diet resistance" and "diet induced obesity"
None of the studies, however provides significant evidence, let alone "proves", that there was a general physiological response to intentional weight loss that would make subsequent reductions in body weight harder and maintaining your weight (assuming this is not already in the skinny / anorexic zone) near to impossible!
The general message should thus be clear: A "diet" (as in restricted eating) is always just a temporary tool to be used within the broader context of lifestyle changes that are designed to maintain a healthy weight and improve the cardiovascular, and metabolic fitness that is the cornerstone of every goal in the SuppVersity's navigation bar, i.e. staying healthy & improving longevity, boosting performance, building muscle, losing fat and even having a fulfilled sex life... and don't fool yourself and take any of those for granted!

References:
  • Anderson JW, Konz EC, Frederich RC, Wood CL. Long-term weight-loss maintenance: a meta-analysis of US studies. The American Journal of Clinical Nutrition. 2001; 74: 579–584.
  • European Society of Cardiology (ESC). Normal weight individuals with belly fat at highest CVD risk. ScienceDaily. August 27, 2012. < http://www.sciencedaily.com­ /releases/2012/08/120827074153.htm > retrieved August 29, 2012.
  • Fontana L, Klein S, Holloszy JO. Effects of long-term calorie restriction and endurance exercise on glucose tolerance, insulin action, and adipokine production. Age (Dordr). 2010 Mar;32(1):97-108.
  • Li X, Cope MB, Johnson MS, Smith DL Jr, Nagy TR. Mild calorie restriction induces fat accumulation in female C57BL/6J mice. Obesity (Silver Spring). 2010 Mar;18(3):456-62. 
  • Myers VH, McVay MA, Champagne CM, Hollis JF, Coughlin JW, Funk KL, Gullion CM, Jerome GJ, Loria CM, Samuel-Hodge CD, Stevens VJ, Svetkey LP, Brantley PJ. Weight loss history as a predictor of weight loss: results from Phase I of the weight loss maintenance trial. J Behav Med. 2012 Aug 21.
  • Wong MHT, Holst C, Astrup A, Handjieva-Darlenska T, Jebb SA.Caloric Restriction Induces Changes in Insulin and Body Weight Measurements That Are Inversely Associated with Subsequent Weight Regain.PLoS ONE. 2012; 7(8):e42858.

Review for Liquid Nitro Low Carb


CAFFEINE CONTENT

160 mg/16 oz. can—I believe.

EASE IN ACQUISITION—1

I’ve known of Liquid Nitro for a while, but I have not for the life of me been able to find it until recently, when I decided to stop by a random, out-of-the-way gas station.  Here on the Western side of the U.S., finding it’s a fluke.  Open question to readers: any of you live anywhere where it’s commonplace?

APPEARANCE/PRESENTATION—8

As with the original, I find the simplicity to convey a firm yet understated confidence that I find quite appealing—if you’re confident enough in your product that that you don’t need to shriek it out to get my attention, then I would say you’ve earned it.

TASTE—7

I had the same experience with Liquid Nitro Low Carb as I did the original in that after I opened the can, I just stood there sniffing it for a minute or so before drinking it.  The smell is complex and very appealing—Red Bull clone to be sure, but much more delicate, and almost floral.  It’s so intriguing that it’s almost a letdown to find out that it’s your run-of-the-mill Red Bull clone, maybe with a hint or two of the herbs in the proprietary blend.  It’s better than most of the Wired Red Bull clones, but at the same time falls far, far short of what the scent led me to expect.

KICK (INTENSITY)—8

At least in terms of energy, Liquid Nitro Low Carb doesn’t disappoint.  In the 16 oz. size, it provides a very satisfactory degree of energy with only marginal jitters.

KICK (DURATION)—8

The effects lasted for the better part of three and a half hours, with only enough of a worn-out feeling after the fact to make me wonder whether I was crashing.

THE DRINK OVERALL—7.67

I have to say I was a little disappointed with Liquid Nitro Low Carb—and it’s all because of that dang scent.  It’s so intriguing, but in the end, it’s coming from something so standard that it’s really quite disheartening.  That said, the herb nuances I detected in the flavor will appeal to some people, even if I found that it didn’t fit with the Red Bull clone mold.  If you can get your hand on a can, try it at least once, and let me know your thoughts—I’m sure that the resulting diversity of opinions will prove interesting.


KEYWORDS: Liquid Nitro Low Carb energy drink review, low carb, low calorie

Review for Liquid Nitro


CAFFEINE CONTENT

80 mg/8.4 oz. can
160 mg/16 oz. can

EASE IN ACQUISITION—1

This was one of those finds I made stopping on a whim at an out-of-the-way gas station—you know, the kind that more often than not yields nothing, but occasionally turns up something I’ve never so much as heard of before.  This was the last can of the original flavor; other than that there were two really beat-up 16 oz. cans of the low carb version, plus one that was in good enough shape to add to my can collection.  Picked up both.

APPEARANCE/PRESENTATION—8

I like the simplicity of the older look; much like Red Bull conveys a silent but certain confidence that makes it very hard to ignore.  The newer one (see the pic of the big can) I like about as much, just in a different way—more in the way I like Monster’s packaging now than Red Bull’s.

TASTE—7

This is one of those flavors that I’m going to go on an on about only to say I have mixed feelings on it.  Popping the top, I took a whiff—and another, and another.  I didn’t drink it for about a minute or so because I was so busy smelling it.  It’s very intriguing—like Red Bull, but delicate and complex—things I never thought I’d say about the smell of an energy drink.  Tasting it, it’s more of a fairly standard Red Bull clone—heavier than the original enough that I wanted to dock a point.  There are some nuances of the herbal constituents of the proprietary blend (the fact that it’s made in Jamaica opens doors to all kinds of jokes there, but I will refrain…), which I liked but found to clash with the semi-cheap Red Bull clone flavor.  Some people are going to think it’s wonderful, others aren’t going to care for it at all—it’s just going to be one of those things that depends entirely upon the person.

8.4 OZ. CAN

KICK (INTENSITY)—6.5

Kick’s not bad for a shrimpy can.  It’s enough of a boost to be considered useful for less demanding energy situations, which I find I experience at least as often as the more demanding ones.

KICK (DURATION)—6.5

I got just shy of three hours here—so not shabby.

THE DRINK OVERALL—6.67

I would have seen more of a kick, but all things considered I can’t complain about the 8.4 oz. can all that much.  At the very least buying it will provide an interesting flavor experience, and I recommend that you try it for yourself if you can get it.

16 OZ. CAN

KICK (INTENSITY)—8

About the same as you’d get out of most any variety of Monster or other standard energy drink—pretty good, but I would love something that went at least a little beyond the norm.

KICK (DURATION)—8

Three and a half hours, no crash.

THE DRINK OVERALL—7.67

Not the best energy drink in the world, but not the worst, either.  Like I said, try it if you can get it, and leave your comments below.


KEYWORDS: Liquid Nitro energy drink review, herbal energy, Jamaican energy drink

Anime Revolution - Where We Stayed

Because we were registered to go to the convention, we got a major discount on staying at the Marriot Pinnacle, right in downtown Vancouver. 
I almost puked when the concierge told me we were staying on the 22nd floor.


 I remember my last big elevator ride! It didn't end so well. See the guy in grey, he's sitting on my handle! See the kid in front of me in the pink, she was going on and on before the ride about how it wasn't scary at all, her friend in the black and grey stripes was going for her first time. I can't figure out how the people with their arms up are staying in their seats.
Anyways, I made it up to the 22nd floor with the help of the bell hop, who was less creepy then the Tower of Terror one. 

 The view was awesome. 
 This little park had food trucks around it on Friday, but none over the weekend. 
 The parking was a whopping $30 a day. But it was secure and we could come and go all day. The street parking was $6 an hour.
 The room was nice, could have been a little bigger. The bathroom had a tub and a shower!

 The hotel is located one block from the ocean and 4 blocks from Robson street. We walked forever. 
We were headed to Meat and Bread when we saw the clock. We couldn't figure out why everyone and their grandma were standing around it, and across the street from it with their cameras pointing at it. So like a tourist, I took a picture. Big whoop. Then as we were walking away, the clock struck 12 and started puffing out steam and music. Go figure!


 This one spent much of her time looking out the window, she decided Shaw and TDCanadatrust waste too much money on electricity by not shutting lights out at night. 
 She got up the next morning and resumed her post.
 A few blocks away, a new Michaels celebrated their grand opening. It was weird to see it right across the road from Tiffany's.
 Who wants to eat lunch?

 It's hard to believe how big the cruise ships are. We watched them load luggage on to it. Some guy held a rope and looked at his phone. I wonder how much he gets paid to do that?
 From our room we could see the convention goers coming and going all day.


 We were close to at least 5 Starbucks.

 Those ants at the crosswalk were our ants. Because we could see them walk half way to Canada Place, and they are 16 years old, we let them go off each morning and come back each day by themselves. 
 We were a short drive to Stanley Park so we took a drive at dusk. Emily took this one for me. 
We'd definitely stay there again, it was so handy to come and go all day. There was also a pool, and a hot tub, which we used once for our sore feet. Kerry used the gym to go for a bike ride one morning. It was so close to everything. 2 thumbs up. 
Oh, the service was outstanding! The wifi, not so much.

Mercury in Fish NOT Harmless, Regardless of Cysteine, Selenium, EPA or DHA! Plus: No Cardioprotective Effect of Omega-3 in Men With Higher Hair Mercury Levels

Image 1: Nice! Luckily nothing you will catch everyday, because if you ate this little bastard, a Tile Fish from the Gulf of Mexico, everyday, you could - in the worst case - be consuming 933µg of mercury with every 250g serving!
"Mercury from fish is not a problem, because you get plenty of selenium to counter it... moreover it's mostly protein bound, already..." - Another Myth Busted!? I must admit, I did believe (without ever checking scientific references) the common mantra that the mercury (Hg) content of fish would not actually be a problem, as long as there is enough selenium (Se) in the fish to "buffer" the Hg load. Now, this certainly makes sense and even very recent studies confirm that the effective uptake is reduced with higher Se:Hg ratios (e.g. Calatayud. 2012). Moreover, the notion that selenium exerts a protective effect is bolstered by data from various indigenous populations in the Brazilian Amazon (Lemire. 2011).

Cysteine, Omega-3 & Selenium? Won't help!

Unfortunately, a recent study by a group of scientists from the Arcachon Marine Station in Acachon, France, does now remind me why I have made it a rule over the year to question every conventional wisdom regardless how logical it may seem (Bourdineaud. 2012). The researchers fed a group of mice diets that contained either 4.88% fishmeal powder that had been produced from the flesh of H. aimara fish that had been caught in the Sinnamary River in French Guiana and contained 5µg Hg/g or a control diet which had slightly less protein (14.2% vs. 18.1%) and contained higher concentrations of EPA(10x), DHA(>30x) and DPA (>5x) - obviously right from the fish.
Figure 1: Fatty acid composition of the diets (left) and breakdown of the omega-3 part of the diets (rel. to total PUFA content - right; data calculated based on Bourdineaud. 2012)
In addition, the fish diet contained methylmercury in its purportedly less toxic largely peptide bound form, methylmercury-cysteine (MeHg-cysteine), while the mercury the scientists had added to the control diet was the purportedly more toxic salt form of mercury, i.e. methylmercury-chloride (MeHgCl).
Which fish contains how much mercury? I knew you would ask this and in essence it is impossible to answer without analyzing the very same fish, because as we are about to see, even the same species from the same fishing ground won't do.

Figure 2:  Mean (bottom axis!) and max (top axis!) mercury content (mg/kg) in fish (based on FDA Monitoring Program. 1990-2010)
Now, I would be a hilarious smartass if I left you with this "you never know" statement, but would still advice you to regard the following information as very broad estimations and heavily generalized categorizations:
  • the worst offenders: Mackerel, King Shark, Swordfish & Tilefish (from the Gulf of Mexico) with mercury levels in the 1,000µg/kg range - 250g of those and you are on par with the mice in the study
  • examples from the rest of the pack (see figure 2): It is plain to see that even fish with a relatively low mean mercury concentration such as Pollock (mean: 31µg/kg) can be laden with mercury, if you just pick the wrong one (max: 780µg/kg!)
Regardless of in some cases 20x higher outliers, you are probably on the safer side of things, when you pick one of the fish / shellfish that are on top of figure 2 and thus have the lowest mean mercury concentration.

How much did the mice consume? With  253 and. 237µg/kg in the MeHgCl and fish diets the mice in the study at hand consumed ~1µgof mercury per day this corresponds to a human equivalent dose of approximately 3.2µg/kg or 263µg/day for a 80kg adult.
Next to the aformentioned selenium argument (the selenium content of the fish diet was likewise higher 480 vs. 300µg/kg), the presence of MeHg-cysteine instead of MeHgCl and the healthy fish oils, are arguments #2 and #3 in the unquestionably convincing "mercury from fish is not a problem" argument.

It takes 8 weeks of mercury expose for the mice to go havoc - only from fish, though!

The mice were maintained on the diets for either 29 or 58 days. At the end of the exposure period, mice were subjected to an open-field maze test, in order to quantify anxiety levels, and to a Y-shaped maze test, to assess cognitive ability. Thereafter, the rodents were anesthetized and tissue samples were taken. Here are the main findings:
  • within the first 10 days of the feeding period, the mice on the Hg containing diets gained  weight faster than rodents on a non-Hg control diet - 4%  and 7.4% more weight gain in the MeHgCl and Fish group, respectively; afterwards the weight development was identical
  • both Hg diets lead to significant increases in serum and tissue MeHg with the kidneys being the "preferred" storage place with a tissue concentration of 7.3 and 6.8 mg Hg/g in mice fed the MeHgCl and fish diets, respectively (17x and 16x higher than in controls); there was a statistically significant inter-group difference only in the striatum, which accumulated ~30% less methylmercury in the fish group compared to the MeHgCl group
  • significant behavioral abnomalies did only occur on the 2nd test at the end of the study period (day 58) and were exclusive to the Fish group, which also exhibited an increased dopamine metabolic turnover in the hippocampus
In the end, there is little to add to the scientists somewhat disillusioned conclusion that despite the fact that they had had good reason to assume (like you and I ;-) that the mercury induced metabolic and neurocrine perturbations in the Fish group "should appear less severe than that observed with the MeHg-containing diet [..] the present study" falsified the original hypothesis and suggests that rather than being less toxic, the peptide bound MeHgCysteine in fish is even more toxic than its chloride bound counterpart.

"Mice are nice, but what about men? I am sure know fish oil protects us!" Not really, no...

Another of the pieces that's still missing to get at least a preliminary grasp of the fish oil, selenium, mercury-toxicity puzzle, comes from a recent study that's been conducted at the University of Eastern Finland in Kuopio, and in the course of which the scientists analyzed the relation of mercury exposure (as quantified by hair mercury levels), long-chain poly-unsaturated fatty acids (LC-PUFA = omega-3) levels and individual risk of CVD, in general, and sudden cardiac death, in particular, in a group of 42-60 year-old men who had been free of any adverse cardiovascular events at baseline in 1984-1989 (Virtanen. 2012); and the results Virtanen et al. present in a paper in the July edition of the free medical Journal PloS One are astonishing, to say the least:
  • of the three long-chain polyunsaturated fatty acids, EPA, DHA and DPA (=docosapentaenoic acid), only the latter, i.e. DPA, correlated significantly with the absence of sudden cardiac death within the time to the follow up (p < 0.01)
  • the by far best predictor of whether or not the study participants would pass away before their time was yet the hair mercury content, which was 53% higher in those unlucky 91 patients who died from sudden cardiac death, than in the "survivor" group (2.85µg/g vs. 1.86µg/g)
Before we take a closer look at how this translates into the calculated hazard risks, I do yet feel inclined to draw your attention to some more basic, and not statistically processed baseline characteristics of the participants with the highest (4.96–15.59%) serum LC-PUFA values.

Don't deduce from pairs of associations!

A brief lesson in interpretation of scientific data - If A & B, and A & C, then B & C... NO!

Actually this thing about associations and logical reasoning is nothing extraordinary, but I thought it may be worth reminding you not to make the false assumption that  "if A is associated with B and A is associated with C, then B must be associated with C, as well", or to give you a more concrete example: If people with high LC-PUFA levels have higher incomes and people with high LC-PUFA levels have higher mercury levels, then people with higher mercury levels should also have higher incomes"

I see, now you are laughing, but I bet, everyone of us has once fallen for a similar mistake, esp. if the result of this falsely applied deduction was in support of your original hypothesis.
The study participants with the highest long-chain omega-3 levels in their blood also had the highest...
  • physical activity (borderline significant p = 0.06)
  • income (p < 0.001) and eduction (p = 0.01)
  • fish, fruit, berry and vegetable intakes (p < 0.001)
  • the highest hair mercury concentration (p < 0.001)
  • the highest alcohol intake (p < 0.001, and 53% more than those w/ 1.7-3.9% LCPUFA)
  • the highest rates of coronary heart disease in the family (p = 0.03, but only 6% difference total)
Despite the fact that higher mercury levels in the had were thus obviously associated with higher omega-3 levels in the blood, it would be preliminary to assume that all other of these variables, such as a higher income, or the physical activity would also be associated with higher mercury levels. And in fact, the exact opposite is the case,...
  • higher income,
  • higher education,
  • higher fruit and vegetable intake and
  • higher physical activity
... all of which were also associated with higher omega-3 levels in the blood were statistically significantly associated with lower mercury levels!

Mercury, fish oil and heart disease a marvelous triumvirate 

Let's get back to the harzard ratios and how fish oil intake and methylmercury intoxication interact in terms of the sudden cardiac death risk of the middle-aged (mean age at baseline 52.1 years) study participants.
Figure 3: Hazard ratios relative to lowest - adjusted for age and examination year (model 1),  adjusted for model 1 and body mass index, pack-years of smoking and alcohol intake (model 2),  adjusted for model 2 and hair mercury content (model 3); and hazard ratios associated with each 0.5%  unit increase in serum LC-PUFA, stratified by the median hair mercury content (calculated based on model 2, right; data compiled based on Virtanen. 2012).
While there is certainly much that could be said about the overall study outcome, there are three things that are remarkable, novel and particularly noteworthy in the data in figure 3:
  • EPA is not only useless, without additional statistical shenanigan, it is even associated  (yet non-significantly) with an increased risk of CVD, when it's really high (+2% risk increase for each unit increase in EPA).
  • DHA is only protective, when the methylmercury levels are low (model 3 in figure 2 adjusts for that), when this is the case, however, each unit increase in DHA is associated with a whopping -19% decrease in
  • the statistical significance of the protective effects of DPA against sudden cardiac death is lost, when the data is adjusted for body mass index, pack-years of smoking and alcohol intake.
If we take the interactions with the hair (and thus presumably bodily) mercury load into consideration (see figure 3, right), it becomes obvious that hair mercury levels above the >1.28mg/g range renders both EPA and DHA practicually useless.

"Where do I get this DPA from; and what's that anyway?"

Figure 4: Enzymatic cascade from ALA to DHA; if you take a closer look the cascade does also explain why an increased conversion of ALA can competitively reduce the generation of EPA (see Portolesi. 2007)
Unfortunately, EPA and DHA are the two major forms of long-chain omega-3 fatty acids you will find in supplemental and dietary fish oil, so that your body will have to derive the DPA via Δ5-desaturase from EPA on its own (Leslie. 1985; see my illustration in figure 4 to get an idea of the whole cascade). This is not impossible, but obviously a rate limited step that could be avoided by direct supplementation, which is in fact something Miller et al. have done, only recently, and, as you have read, right here at the SuppVersity (see "On Short Notice" from July 29, 2012), which remarkable success (Miller. 2012).

Whether the beneficial effects of DPA are in fact related to its "reservoir function", Miller and his colleagues speculate about, cannot be said but would certainly constitute an intriguing research question for another rodent trial, maybe the mice in the Bourdineaud study would have been normal if they had had more DPA in their diets (see figure 1, right)

Bottom line: Until more scientific data is available (and probably still thereafter), there are actually three practical implications from this study you should bear in mind: (1) It does not make sense for anyone who carelessly shovels down tons of potentially mercury loaden fish to freak out about a tiny amalgam filling; (2) if you intend to benefit from the cardioprotective effects of fish oil, you better make sure that you are getting supplements and fish that have been tested for mercury, because the selenium alone obviously won't do the trick and save your ass... ah, pardon, your heart ;-) and (3) if you don't eat the worst offenders on a daily basis the benefits will probably still outweigh the negatives: I have recommended to fatty fish once or twice a week numerous times in previous articles and I don't see why these results would change anything about the recommendation.

References:
  • Bachmanov AA, Reed DR, Beauchamp GK, Tordoff MG. Food intake, water intake, and drinking spout side preference of 28 mouse strains. Behav Genet. 2002 Nov;32(6):435-43.
  • Bourdineaud JP, Marumoto M, Yasutake A, Fujimura M. Dietary mercury exposure resulted in behavioral differences in mice contaminated with fish-associated methylmercury compared to methylmercury chloride added to diet. J Biomed Biotechnol. 2012;2012:681016. Epub 2012 Jul 26.  
  • Calatayud M, Devesa V, Virseda JR, Barberá R, Montoro R, Vélez D. Mercury and selenium in fish and shellfish: Occurrence, bioaccessibility and uptake by Caco-2 cells. Food Chem Toxicol. 2012 Aug;50(8):2696-702. Epub 2012 May 22. 
  • Lemire M, Fillion M, Frenette B, Passos CJ, Guimarães JR, Barbosa F Jr, Mergler D. Selenium from dietary sources and motor functions in the Brazilian Amazon. Neurotoxicology. 2011 Dec;32(6):944-53.
  • Miller E, Kaur G, Larsen A, Loh SP, Linderborg K, Weisinger HS, Turchini GM, Cameron-Smith D, Sinclair AJ. A short-term n-3 DPA supplementation study in humans. Eur J Nutr. 2012 Jun 23.
  • Portolesi R, Powell BC, Gibson RA. Competition between 24:5n-3 and ALA for Delta 6 desaturase may limit the accumulation of DHA in HepG2 cell membranes. J Lipid Res. 2007 Jul;48(7):1592-8. 
  • Virtanen JK, Laukkanen JA, Mursu J, Voutilainen S, Tuomainen TP. Serum Long-Chain n-3 Polyunsaturated Fatty Acids, Mercury, and Risk of Sudden Cardiac Death in Men: A Prospective Population-Based Study. PLoS One. 2012;7(7):e41046.